Try It: A Real Example Protein
Every confidence-metric explanation in this guide is easier to trust once you've actually seen it on a real structure. Below is a live, interactive Mol* viewer loading a real entry straight from the AlphaFold Protein Structure Database — not a screenshot.
Beginner
This is BRCA1 (UniProt P38398) — the same protein already used as the AlphaMissense-mapping fetch example in ChopChopMF Workflows. It's a genuinely good teaching example, not a cherry-picked pretty one: BRCA1 is a large, famously mostly-disordered protein with only a couple of small, well-folded domains (a RING domain near the N-terminus, a tandem BRCT domain at the C-terminus). Drag to rotate, scroll to zoom, and watch how the color maps directly onto what's structured vs. disordered.
Advanced: what you're actually looking at
The structure is colored by pLDDT using Mol*'s built-in AlphaFold confidence theme — the same orange → blue scale from the Confidence Metrics page, fetched live from AlphaFold DB. The real numbers for this exact entry, pulled from the same API the viewer uses:
| pLDDT band | Fraction of BRCA1 |
|---|---|
| Very high (>90) | 11.1% |
| Confident (70–90) | 6.3% |
| Low (50–70) | 2.2% |
| Very low (<50) | 80.4% |
Eighty percent of this protein is "very low" pLDDT — and that's not a failed prediction. It matches what's independently known about BRCA1: large intrinsically disordered regions connecting a handful of small, real, well-characterized folded domains. This is exactly the pattern discussed in pLDDT is not a clean disorder detector — color, don't just read the number.
Here's the real PAE plot for the same entry:
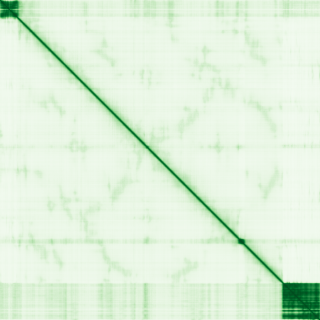
Notice the single small dark block near the bottom-right corner — that's the folded BRCT domain. Everywhere else is light: no confident relative positioning, consistent with a long, floppy disordered chain. Exactly the PAE lesson: pLDDT and PAE are telling the same story here from two different angles.
That same BRCT domain is also the worked example for cropping a real rigid domain before a Foldseek search — see Structure vs. Sequence Homology.
Data source & license
Structure and confidence data fetched live from the AlphaFold Protein Structure Database (EMBL-EBI / DeepMind), available under CC-BY 4.0. Viewer: Mol* (MIT license), self-hosted with this guide — no external viewer service or account needed, though the structure data itself is fetched from AlphaFold DB when this page loads.
Reproduce this yourself, locally
Advanced: raw ChimeraX commands
No plugin needed for the basics — three commands in the ChimeraX command line reproduce everything on this page:
The first fetches the structure directly from AlphaFold DB by UniProt ID (equivalent: alphafold fetch P38398). The second applies the same blue/orange pLDDT palette shown above — AlphaFold-fetched structures store pLDDT in the B-factor column, so this is really just "color by B-factor with AlphaFold's palette." The third fetches and opens the interactive PAE plot for the same entry.
Expert: the same thing via ChopChopMF (no commands typed)
If you'd rather point-and-click, this is exactly ChopChopMF workflow 1:
- Fetch PDB → AlphaFold2, enter
P38398, fetch. - Select the model, click pLDDT Coloring.
- Optionally run AlphaSync Residue Analysis on the same model for the full per-residue table (pLDDT, SASA, RSA, disorder, secondary structure) instead of reading colors by eye.
ChopChopMF's PAE tools (workflow 5) are built for multi-chain complexes specifically — for a monomer like this one, the raw alphafold pae command above (or the PAE Viewer) is the more direct route to the same plot shown here.
Continue to Reading Confidence Metrics →